Advanced Debugging – Conditional Breakpoints

Debugging is an inevitable part of embedded software development. The xsbug debugger in the Moddable SDK contains powerful tools to help you debug efficiently. This series of blog posts on advanced debugging introduces powerful new features of xsbug to help you debug your embedded JavaScript.
This post is all about the new support for conditional breakpoints. Conditional breakpoints let you control when a breakpoint stops based on conditions like the value of local variables and the number of times the breakpoint has been encountered. Conditional breakpoints allow you to stop only when the specific conditions have been met that of interest to the bug you are investigating.
xsbug has always supported unconditional breakpoints, breakpoints that stop every time they are encountered. Now you have the option to use JavaScript expressions to control when a breakpoint stops. An unconditional breakpoint is like adding a debugger statement to your source code. A conditional breakpoint is like adding an if statement with a debugger:
if (this.dx >= 3)
    debugger;
Speed is the major advantage of using a conditional breakpoint over code. With a conditional breakpoint, your project doesn't have be rebuilt, downloaded, and restarted. The conditional breakpoint is set instantly while your project is running. This saves a huge amount of time.
Conditional breakpoints are fast too - they run at the speed of JavaScript. The conditions are evaluated entirely on the embedded device without any communication with the debugger running on your computer.
Setting a Conditional Breakpoint
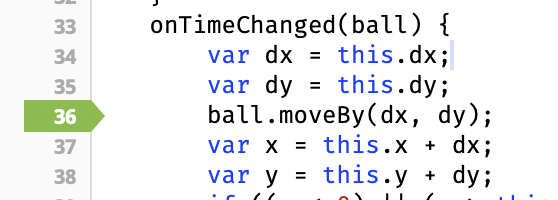
To create a conditional breakpoint, first create an unconditional breakpoint by clicking to the left of the source code line.
Next, bring up the breakpoint editor by tapping the green breakpoint arrow.
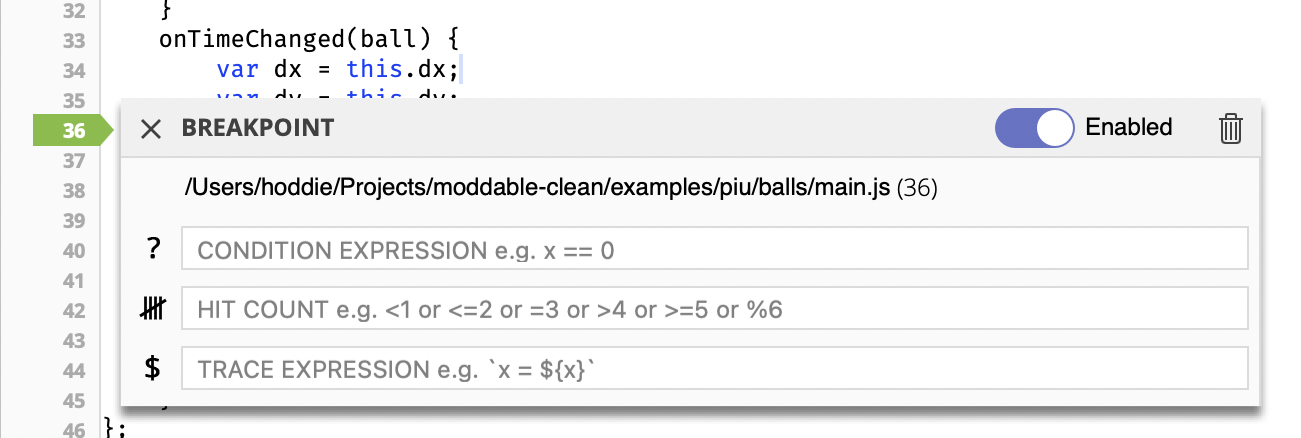
All you need to do to make this a conditional breakpoint is input a condition on the line labeled "Condition Expression". This can be any JavaScript expression. Once you've entered your expression, either click the "Set" button on the right or press the return key to install the condition. To clear the condition, just delete the conditional expression and click "Set".

Any expression that evaluates to a truthy value triggers a breakpoint. The expression this.dx > 3 evaluates to true when this.dx is greater than 3 and false otherwise. To check if this.dx is non-zero, you can simply use this.dx as the expression.
Complex Conditional Expressions
Because the conditional expression is standard JavaScript, you can do quite a bit. In addition to accessing local variables and this, the condition can also access global variables. For example, to see if the this.x position is in the bottom 20 pixels of the screen, use this.x >= (screen.height - 20) where screen is a global variable. To be explicit about accessing the global variable, you can also write this.x >= (globalThis.screen.height - 20).
Calling Functions
Your expression can call functions too. For example, to break when the location of an object is within 12 pixels of the origin (0, 0), use Math.sqrt(this.x ** 2 + this.y ** 2) < 12.
You can even use conditional breakpoint expressions to perform simple conditional operations. For example, to stop an object from moving when it reaches the right 20 pixels of the screen, use (this.x >= (screen.width - 30)) ? ball.stop() : false. This is a bit of an unintended use of conditional breakpoints, but it can be a useful technique when tracking down a bug. Note that the expression never triggers a breakpoint because neither the return value of ball.stop() (undefined) or false are truthy values.
Private Fields
Your conditional expressions can access the private fields of an object. But, because XS works hard to keep private fields in your code private, there is a restriction. Your conditional expression may only access the private fields used by the function where the breakpoint is located.
To understand that, consider the following class with two private fields:
class Example {
    #a;
    #b;

    constructor(a, b) {
        this.#a = a;
        this.#b = b;
    }
    getA() {
        return this.#a;
    }
    getB() {
        return this.#b;
    }
}
- Conditional breakpoints in the
constructor may access both #a and #b
- Conditional breakpoints in
getA() may access #a, but not#b
- Conditional breakpoints in
getB() may access #b, but not #a
Hit Count Breakpoints
Hit Count breakpoints are another kind of conditional breakpoint. They allow you to have a breakpoint trigger after being hit a certain number of times. This is very useful if you know a problem happens the 12th time a given line of code executes. Or perhaps you want to inspect the state of the program after a particular function has been called 1000 times.
You can break on the 10th time the breakpoint is encountered by setting the hit count expression to = 12. Note that it is implicit that the count is on the left side of the expression, so you can think of this expression as count = 12. Note that for consistency with debuggers for other languages, it uses = instead of ==.

Here are some other examples of hit count expressions:
> 12 – breaks after the first 12 times the breakpoint is encountered< 12 - breaks the first 12 times the breakpoint is encountered% 12 - breaks every 12th time the breakpoint is encountered
Combining Conditional and Hit Count Breakpoints
You may have noticed that the breakpoint editor shows expressions for Conditional and Hit Count breakpoints. If you fill in both of those, the two are combined. Let's look at an example to understand how that works.
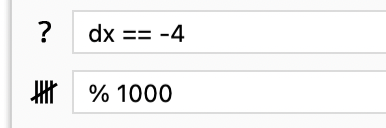
The conditional expression is dx == -4 and the hit count expression is % 1000. Each time the conditional expression is true (e.g., dx is equal to -4), the hit count's counter is incremented. The hit count expression of % 1000 means to break every 1000 times the conditional expression is truthy. As a result, every 1000th time that the breakpoint is encountered with dx equal to -4, the breakpoint stops.
Errors in Conditional Expressions
As expressions get more complex, you might make a mistake in the expression. If that happens, xsbug logs an error message to the debug console when evaluating the expression. For example, if you enter that.dx > 3 the error message logged is as follows. Notice that the file path and line number correspond to the location of the breakpoint.
$MODDABLE/examples/piu/balls/main.js (37) # ReferenceError: get that: undefined variable
Dead Strip Errors
There's one special error to be aware of: dead strip. As you may know, the Moddable SDK defaults to minimizing the size of the JavaScript engine by removing language features your project doesn't use. This speeds download time and maximizes flash memory space for your project's code. But it also means that your expression might call a function that is unavailable. When that happens, you'll see dead strip error.
If you need to call function that's been removed, you have a couple of options. The easiest is to disable minimization of the JavaScript engine. You do that in your manifest by adding an empty strip section (read more about the strip options here):
"strip": [],
If flash space is tight, an alternative is to add only the functions you need to access by referencing them in your project's code. For example, to make Math.sqrt available, just reference it -- you don't even have to call it. A good place to do this near the top of your source file, right after the import statements.
import {} from "piu/MC";

Math.sqrt;
Debug, Conditionally!
Conditional expressions and hit counts are powerful new tools to accelerate your debugging. Take some time to explore them so you can start using them in your next debugging session. With just a little practice, you'll find using them becomes second nature.
The examples in this article are from the Piu Balls example. You might use that project for to try out these new debugging tools. Also, keep in mind that all of these debugging features are also available in the Moddable SDK's simulator, so you can try this out on your computer too.
The next article in this series on Advanced Debugging will introduce Function breakpoints and explain how the XS JavaScript is able to deliver these powerful debugging features on extremely resource constrained embedded hardware.