Deliver High-Performance Products with the XS Profiler
Everyone involved in delivering software for resource-constrained hardware knows that performance is a key challenge. Low-cost hardware has just enough performance to make a great product possible, but only if the software is careful not to overwhelm the hardware. It is easy to notice that a product is performing slowly. What's difficult is figuring out why it is slow. That's where a performance profiler is critical. Instead of a software developer relying on intuition to guess which functions take the most time, a profiler shows them.
When developers know which code requires their attention, they focus their time in the right place. Fortunately, even in large projects, performance hotspots are usually limited to just a handful of functions. A targeted optimization effort doesn't need to take a lot of development time.
Moddable's XS JavaScript engine has a built-in performance profiler. It is a sampling profiler, which means it doesn't measure the execution time of every execution of every function, but instead periodically checks which functions are running. This works because statistically the functions taking the most time running will be sampled the most. XS samples execution 800 times a second to generate a very accurate view of which functions are taking the most time.
Profile Anytime
The XS performance profiler is always available during development. The sampling support included in every debug build. Developers start profiling with a quick button press in the xsbug JavaScript debugger. There's no need to create a special build of the project for profiling and no new tools to set up or run.
Convenient, instant access to profiling is a game changer because it allows developers to analyze their project's performance at any point during development. As developers make changes to improve performance, they can immediately profile the results to know just how effective their changes have been.
Profile Anywhere
The XS performance profiler runs on both microcontrollers and desktop simulators. Profiling performance on the target microcontroller is obviously essential, because that's ultimately what the customer will experience. But being able to profile on the simulator is valuable too. Programmers developing with the Moddable SDK use the simulator to speed their work because the simulator provides faster development turnaround time, allowing them to iterate quickly. Once their code works on the simulator, they verify execution on the target microcontroller. Performance profiling of a project in the simulator gives a good first-order view of performance hotspots, despite the greater CPU power available to the simulator.
Often projects defer performance work to the end of product development. The problem with this approach is that optimizations can be disruptive, a problem as the deadline to ship approaches. This causes project leaders to be tentative about making performance improvements, which results in shipping underperforming products. Because the XS performance profiler is always available, developers can monitor and tune their code's performance from the start, avoiding the need for tough choices later.
Demo
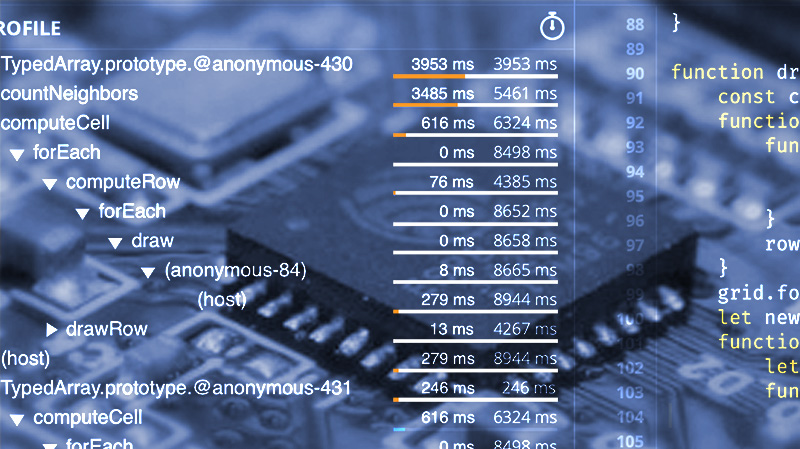
To appreciate just how easy it is to profile the performance of JavaScript running on a microcontroller, watch this video. It shows a profile being generated in realtime for a Game of Life application running on Moddable Two powered by an ESP32. The profile is dynamically updated and sorted to show the functions taking the most total execution time at the top.
Because the profile is interactive, exploring the results is easy. When the mouse is over a function, xsbug shows the source code file name and line number, if available. Clicking the file name reveals the source code of the function. To see the stack track with the caller of this function, click on the disclosure triangle to the left of the function name.
Implementation Challenges
Adding a performance profiler to any JavaScript engine is not easy, which is why many JavaScript engines don't offer one. The challenge is even greater for XS because the profiler needs to work on microcontrollers with limited CPU power and memory. These are a few of the challenges Moddable had to solve to make the XS performance profiler a reality:
- Minimize CPU overhead – Sampling JavaScript execution 800 times a second can take quite a bit of time which could change the behavior of the code being profiled. The XS profiler is optimized to use well under 1% of the CPU when profiling.
- Minimize memory use - The sampling profiler generates a lot of data on a microcontroller that has very little memory or storage space. XS solves this by streaming the profile samples to xsbug so that the microcontroller holds only a few samples at a time.
- Maximize communication throughput - The communications channel to xsbug is a serial connection running at between 500 kbps and 1 Mb/second limiting how much data may be sent. XS compacts the profiling data sent to xsbug to avoid congestion on the xsbug connection.
- Zero overhead when inactive - If a profiler introduces significant overhead when not in use, developers will disable the profiler, which means they will use it less often. The XS profiler has no memory or CPU overhead when not actively profiling.
- Show function names - Many commonly-used JavaScript language features create anonymous functions (functions with no names), which complicates analyzing the profile results. As part of implementing the profiler, Moddable enhanced XS to provide names for more functions and to assign unique numbers to distinguish functions it cannot name.
Conclusion
By giving developers insights into the execution of their code, a performance profiler focuses optimization efforts in the right place. The result is a project that delivers great performance on schedule despite the challenges of running on the low-cost, resource-constrained microcontrollers that power consumer and industrial IoT products.
Most embedded development environments don't include a performance profiler. If they do, they are seldom used because they are inconvenient. The professional performance profiler in the Moddable SDK's XS JavaScript engine makes this powerful tool available to embedded software developers to use throughout product development with just a simple mouse click.