# Advanced Debugging – Function Breakpoints

This post introduces function breakpoints, a tool to break on every function that has a specific name. The previous post in this series introduced conditional breakpoints and hit count breakpoints.
Function breakpoints are particularly valuable when working with JavaScript classes, as it is common to have several different implementations of a single method or callback. For example, the ECMA-419 standard invokes the onReadable callback function when data is available to be read. You may be certain that one of those implementations is being called, but not which one. Instead of setting a breakpoint on each implementation of onReadable, you can set a single function breakpoint to break on all of them.
Setting a Function Breakpoint
Function breakpoints are based on the name of the function rather than a file and line number, like traditional breakpoints. Therefore, you can't set a function breakpoint by clicking next to a line of source code. Instead, you set a function breakpoint in the breakpoint pane:
- Select the breakpoint pane by clicking the green breakpoint arrow in the top-left corner of the xsbug window
- Move the mouse pointer over the BREAKPOINTS pane and click the stylized "F" icon
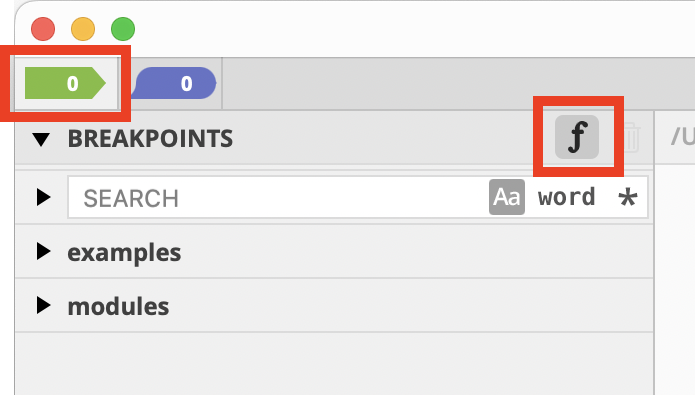
- This displays a variation of the xsbug's standard breakpoint editor dialog with an added field to enter the function name.
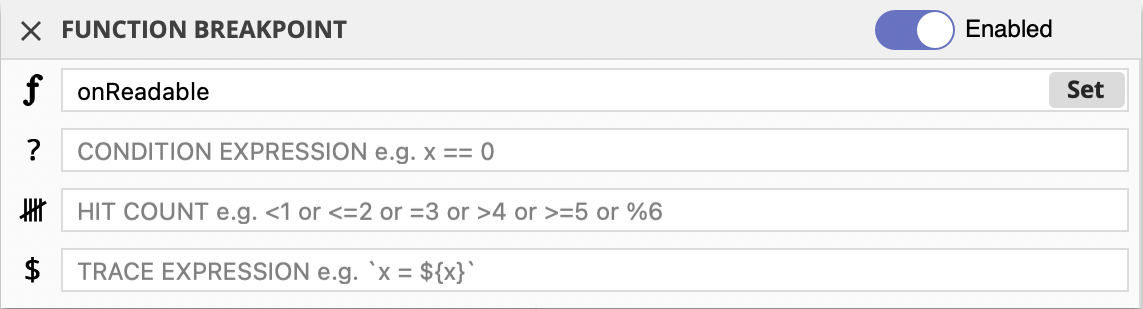
- Set the function name. Here it is set to
onReadable. After entering the function name, either click "Set" or press the return key to install the function name.
Function breakpoints are listed in the breakpoint pane along with other breakpoints. Notice that function breakpoints are displayed in italics to distinguish them from ordinary breakpoints.

Click on the function breakpoint to display the function breakpoint dialog to edit, disable, or delete it.
Function Breakpoints in Action
To see the power of function breakpoints, let's use one in a real-world example. We'll use the fetch example in the Moddable SDK which uses Moddable's implementation of the web-standard fetch() API to make several HTTP and HTTPS requests. It is implemented using standard APIs from ECMA-419, including the HTTP Client, DNS Resolver, UDP socket, TLS socket, and TCP socket. Each of these classes implements an onReadable callback to receive a notification when new data is available to read.
You've already seen above how to set a function breakpoint on onReadable. Once that is in place, run the project. The following commands run the example on the simulator for convenience, but you can run it on an embedded device too.
cd $MODDABLE/examples/io/tcp/fetch
mcconfig -d -m
Once the project starts running, the first break is in the DNS resolver, when it receives a notification that a UDP packet is available to read. This packet is the response from the DNS server with the IP address of the web site for request.

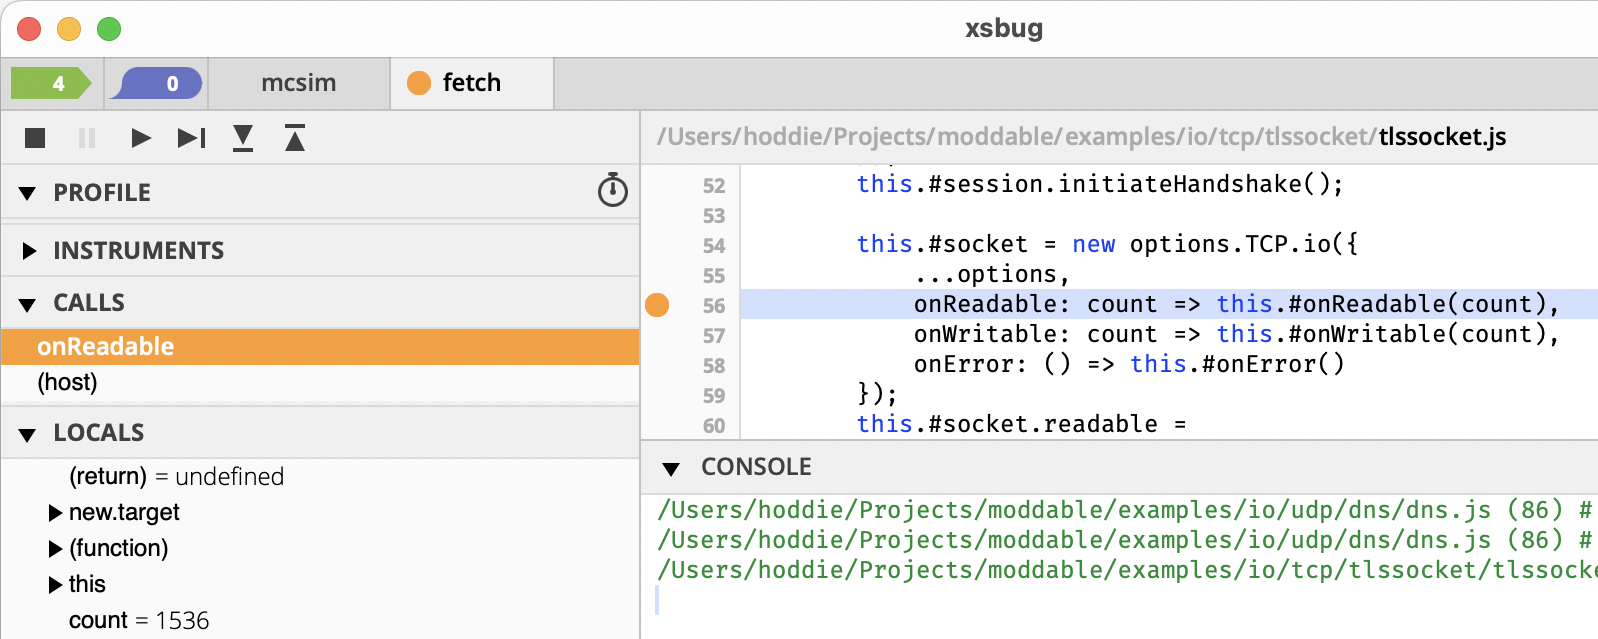
The next onReadable function breakpoint happens in the TLS socket, when it receives the initial response in the TLS handshake.
If you continue execution, you'll see two additional onReadable function breakpoints:
- In
httpclient.js, the ECMA-419 HTTP client implementation
- In
fetch.js, the Moddable SDK implementation of the web's fetch API
As you can see, function breakpoints are a quick and easy way to explore a particular operation throughout a large project.
To explore further yourself, try using the ECMA-419 MQTT client example. Instead of onReadable, set a function breakpoint on onWritable to see when data is being sent.
cd $MODDABLE/examples/io/tcp/mqttclient
mcconfig -d -m
You'll see onWritable being invoked both in mqttclient.js, where data is being sent to the TCP socket, and in main.js, where the application is writing data to the MQTT client.
Combining Function, Conditional, and Hit Count Breakpoints
You may have noticed that the Function Breakpoint editor dialog contains fields for conditional expressions and hit count in addition to the function name. All three of these can be combined to create very precise conditions for the breakpoint.
Here are some examples:
- To always break after the first 100 invocations of
onReadable, set the hit count expression to > 100.
- To break when the
count argument to onReadable is above 1500 (indicating that at least 1500 bytes are available to read), set the condition expression to count >= 1500.
- To break every other time that the
count argument is 1536, set the condition expression to count === 1536 and the hit count expression to % 2.
- To break only when the global variable
state.mode is equal to "downloading" set the conditional expression to `state.mode === "downloading".
Some Details about Function Breakpoints
Function breakpoints rely on the name property of the function. If the function does not have a name, such as an anonymous function, then it cannot be used with a function breakpoint. Fortunately, JavaScript is good about assigning names. For example, this declaration assigns the name onReadable to this seemingly anonymous function:
let onReadable = function() {
}
Unfortunately, private methods do not work with function breakpoints. If you set the function name to #onReadable in the Function Breakpoint editor, it will not break on private methods named #onReadable. This behavior is because JavaScript implements private methods using private fields.
And, of course, because xsbug is a JavaScript debugger, function breakpoints do not work on native methods.
Implementing Complex Breakpoints on Microcontrollers
The advanced breakpoints, like function and conditional breakpoints, in xsbug are extremely powerful and yet they work on microcontrollers (MCU) with extremely constrained resources. All the features described in this series work on an ESP8266 with a few dozen kilobytes of RAM, an 80 MHz CPU, and just 1 MB of usable flash memory. Not only do they work, but they are fast.
Advanced breakpoints are possible on MCU for a couple of key reasons. First, they are evaluated entirely on the MCU, so there is no communication with xsbug running on the computer until a breakpoint stops execution. Communication between devices takes time, so eliminating communication while evaluating breakpoints helps performance.
Second, conditional expressions (and trace expressions, which is the focus of the next article in this series) are evaluated by the same XS JavaScript engine that runs your project. This allows them to be evaluated "at the speed of JavaScript". To do this requires solving one key challenge: compiling the expression's JavaScript source code to the byte code run by XS.
That could be done on the MCU by downloading the expression's source code and using the equivalent of eval. However, that requires that XS's JavaScript compiler be present on the device. Many embedded projects exclude it to save flash space and reduce time spent downloading firmware. We didn't want to require the compiler to be present to use advanced breakpoints. In addition, parsing JavaScript requires temporary memory, which might not be available on a very constrained device.
To solve these problems, we took inspiration from the unique mods feature of XS. Instead of compiling the JavaScript source code on the MCU, xsbug compiles breakpoint expression on the computer and downloads the byte code to the MCU. This happens in the blink of an eye, so you don't even notice. xsbug itself is implemented in JavaScript using XS, so the XS JavaScript engine is already available to do this.
This approach requires that xsbug and the MCU firmware both run the same version of XS. Because the byte code can change between XS versions, the byte code may not execute correctly if there is a version mismatch. xsbug checks the versions when connecting to the MCU. If there is a mismatch, xsbug logs a warning to the console and disables the advanced breakpoints. It can still be used for basic debugging.
Power for Debugging and Exploring
Function breakpoints are a specialized type of breakpoint that can help you quickly debug and explore a large code base. They allow you to quickly locate which implementations of a given function name are being executed without having to set breakpoints manually on each implementation of the function. You can control when they break by combining them with conditional and hit count breakpoints to control. While you might not use function breakpoints every day, they are a uniquely powerful tool to speed your embedded development. Give them a try today so you'll be ready to use function breakpoints in your next debugging session.
The next article in this series on Advanced Debugging is all about trace points, a variation of a breakpoint that speeds console logging during a debugging session.